
The Sigmoids Won't Save You
...

“All exponentials eventually become sigmoids” is an annoying AI talking point. If someone presents a graph like this…
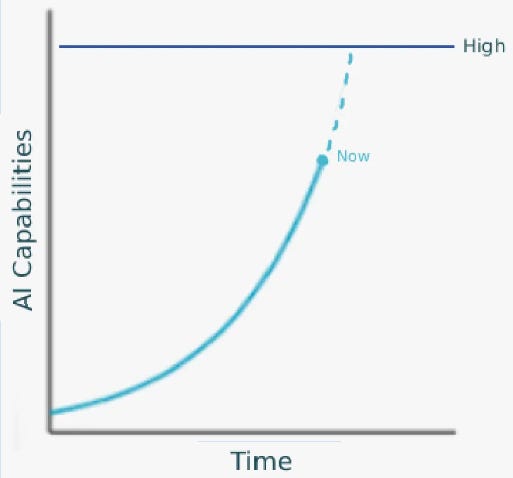
….and points out that it seems like AI capabilities could soon reach the level marked “High”, then the height of intelligent debate is to point out that actually, the trend could go like this:
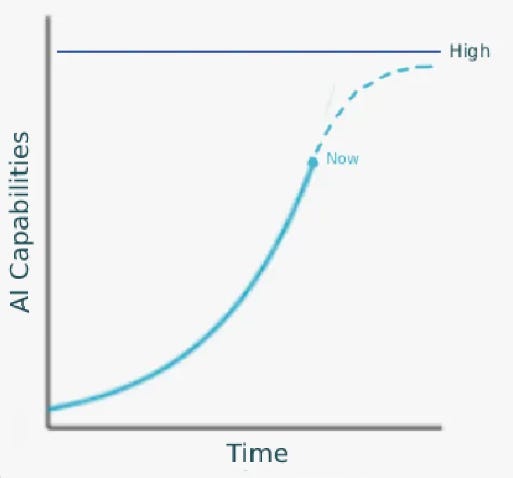
…and then it would never reach the level marked “High”!
In slogan form, this is “all exponentials eventually become sigmoids” (a sigmoid is the s-shape of the second graph, which starts exponential but gradually flattens out). It’s technically true. No process can keep growing forever; eventually it hits physical or practical limits. For example, total cases during an epidemic is classically sigmoid:
They start slow - patient zero infects patient one, and so on. They grow exponentially until most people are infected. Then, as almost everyone is infected and they can only mop up the last few holdouts, they slow down again. Finally, after everyone has been infected, the growth rate is zero.
Technological progress in a given field can also be sigmoid. Here’s airspeed record over time:
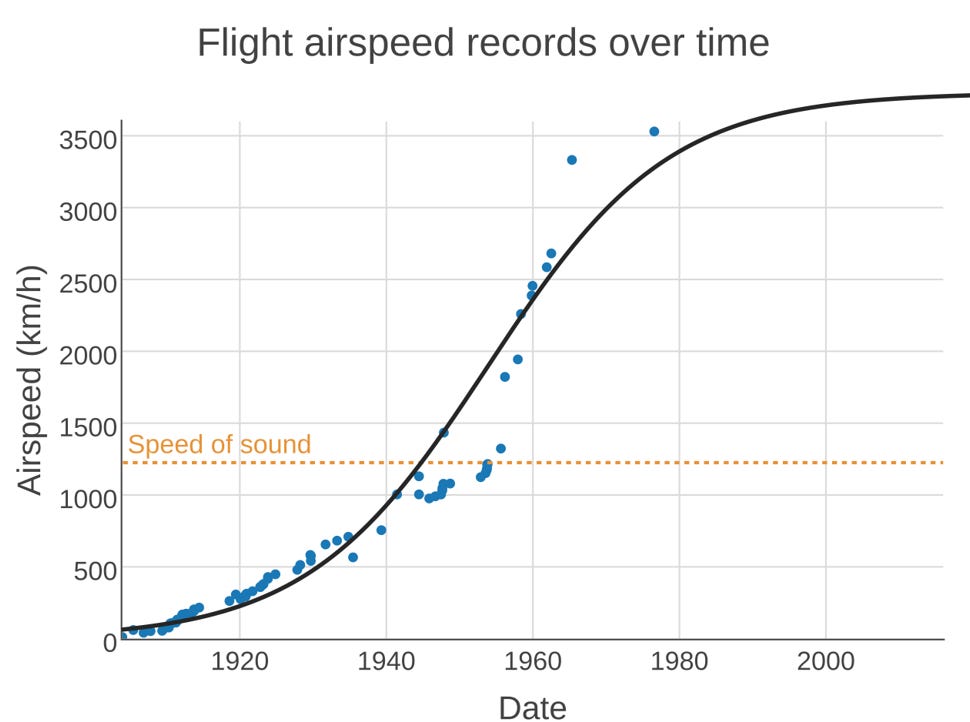
My understanding is that this represents 3-4 “generations” of different technology (propellers, turbojets, etc). Each technology went through normal iterative improvement, then, when it reached its fundamental limits, got replaced by a better technology. The last technology, ramjets, reached its limit at about 3500 km/h, and there wasn’t the economic/regulatory will to develop anything better, so the record stands.
You can imagine something similar happening with AI at some point. Does that mean people are right, and there’s no need to worry that the graph will ever reach the line marked “high”?
Before we come up with a general answer, let’s look at the Sigmoid Misidentification Hall Of Fame.
Third place goes to UN birthrate projections in countries with declining birthrates. These countries’ birthrates keep going down at a constant rate, and the UN keeps predicting they will flatten out and go down at some lesser rate. On this graph, red is the real data, and each blue line is a different UN attempt from a different year to “extrapolate” the “trend”.

It’s true that birth rates must eventually flatten out and become sigmoid (this may have happened last year in South Korea, although Colombia and Chile are still declining), but this doesn’t necessarily happen at the exact moment that forecasters in the UN start feeling like the decline has gone too far.
Second place goes to predictions of solar power deployment, as chronicled by A.E. Hoekstra.

The various WEO lines are World Energy Organization predictions for how quickly solar power will get deployed. Every year, the WEO thinks “Wow, lots of solar power got added last year, probably this year it will level out and people might even back off a little”. Every year, the amount of solar power deployed grows at the same rate.
First place goes to this paper on the METR graph of AI capabilities. In early 2026, when the underlying data looked like this:
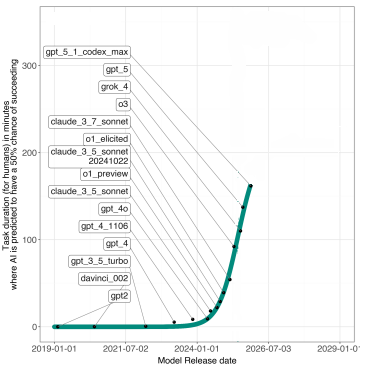
…a team from Wharton tried to model different curves and predicted that the likely future trajectory was this:
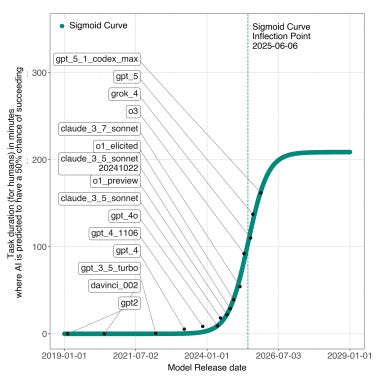
@Tenobrus ably chronicles what happened next (the green curve is their original; the star marks the next AI model to be released after their analysis):

The moral of the story is that, even though all exponentials eventually become sigmoids, this doesn’t necessarily happen at the exact moment you’re doing your analysis. Sometimes they stay exponential for much longer than that!
How much longer?
The best way to predict this is to fully understand the process generating the trend. For example, you can forecast an epidemic by knowing how quickly it replicates, how likely it is to be cured, and how large the susceptible population is. Even in harder cases like airspeed records, a smart engineer could determine that ramjets max out around 3500 km/h, and a smart economist could predict that no country was incentivized to spend enough money to bring the next paradigm to fruition.
What if you don’t fully understand the process? AI forecasters know some things (like how data centers work and how much it costs to build them). But they’re unsure about other things (researchers keep inventing new paradigms of data generation that get over data walls, but for how long?), and other things are entirely opaque (What is intelligence really? Why do scaling laws work? Might they just stop working at some point?) Is there anything you can do here?
In conditions of true ignorance, the default assumption should be Lindy’s Law: on average, a process will continue about as long as it’s continued already.
To build intuition: suppose you walk past a geyser, and see a sign saying “This geyser last erupted 100,000 years ago”. You know nothing else about geysers. What’s the chance it will erupt in the next hour? It must be very low, right? If it erupted in the next hour, you would have walked past it 99.99999% of the way through its eruption cycle - in other words, your random sample had a higher value than 99.99999% of points. That’s not how random samples usually work! On the other hand, suppose you walk past another geyser, and see a sign saying “This geyser last erupted 10 minutes ago”. What is the chance that this geyser will erupt in the next hour? Pretty high, right? It seems like this geyser’s eruptions occur on a scale of every few minutes. When you calculate it out, your median prediction for the length of time until the next eruption should just be the number on the sign. In the same way, your median prediction for how long it should take before an entirely-mysterious trend changes shape should be the amount of time since the last change.
Applying this to AI: the forecasters who try to get deep understanding of the dynamics of AI progress think that we can keep scaling up AI at the current rate for another few years (by building more data centers, etc), and might or might not be able to scale it up faster after that by leveraging recursive self-improvement. But suppose you don’t trust those people. What should your default be?
AI has been improving dramatically since at least GPT-1 in 2017, although most people sort of arbitrarily date “the scaling era” as 2019 to present. So naively, ignoring everything we know and considering the whole field to be a total mystery, we might expect the trend to continue for, on average, another seven years. Assuming a Pareto distribution (what does this even mean in the case of AI? I don’t know) the chance that it continues for less than another two years is 22%.
It’s cheap and easy to make fun of people who extrapolate trends too far:

But if someone claims that the trend toward increasing AI capabilities will never reach some particular scary level, then the burden is on them to explain either:
If they’re not treating AI as a black box, and claim to be modeling the dynamics explicitly, then what is their model? Have they calculated the obvious things, like projected data center growth and speed of algorithmic progress? Are they familiar with the modeling work that’s already been done in this field, like the AI Futures Timeline Model? Do they have specific opinions on how the others went wrong, and where their model differs?
If they are treating AI as a black box, why isn’t their default expectation based on Lindy’s Law?